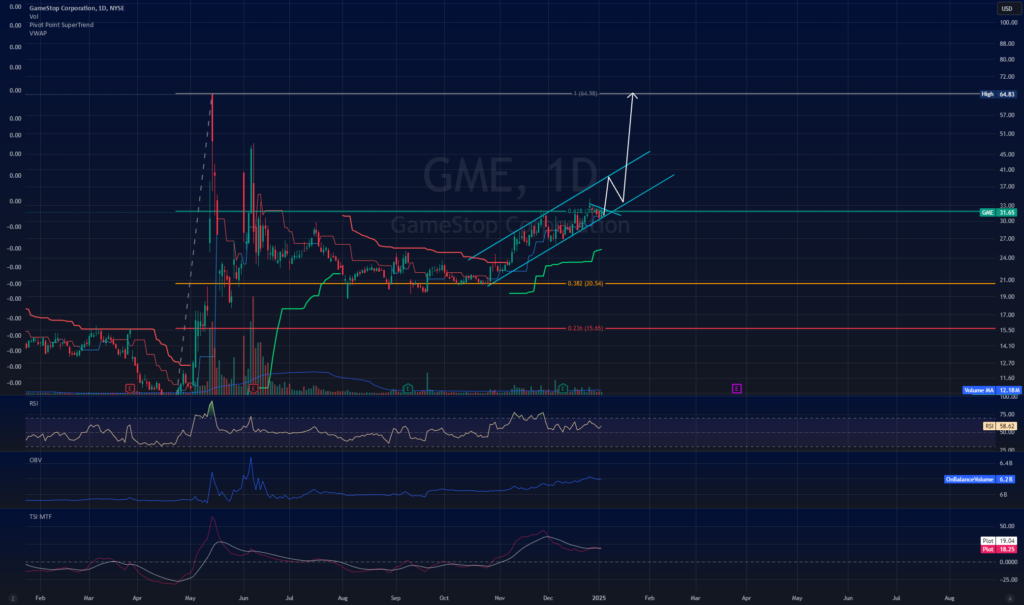
Look at this sexy chart. All of December GME has been hanging out in this upward channel. The bottom line has acted as support not 2 or 3 times, but EIGHT freakin times. Today was critical in my opinion if the trendline was going to remain strong, especially on a Friday given that max pain was sitting under the line at $30.
RSI has also had a support line around 50. We have bounced off that line yet again. Hopefully soon this is the last one.
Another thing to note is OBV which has been steadily climbing indicating that any pullback is just a distribution period before another leg up.
In my opinion, next week we should see GME test the top of that trendline around $40. If it rejects we may see it come down to test the trend line again around $33 or $34. But if it breaks, we could see this puppy FLY to the Fibonacci extension from the May squeeze. We would match that squeeze at $64.98 while the next (log) line is at $205!!
Lets get it!


