DNX
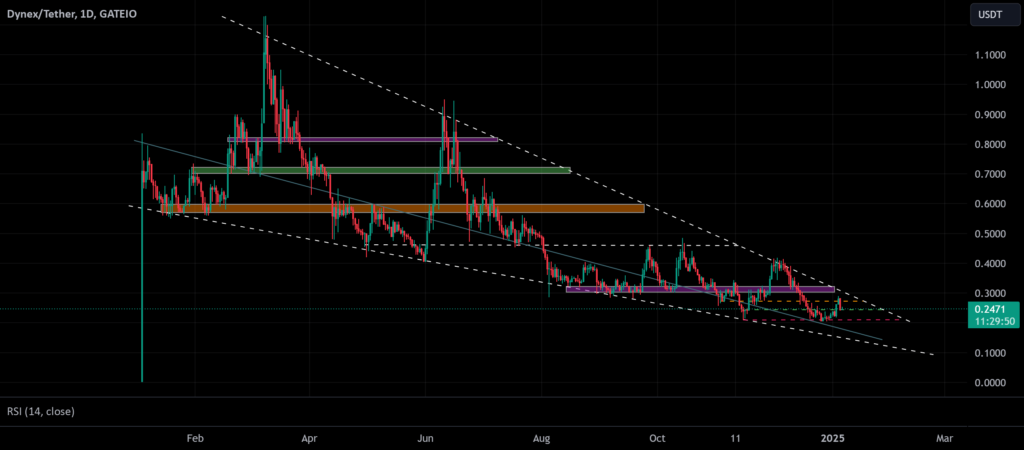
Technical Analysis for DNX/USDT – Key Retest and Support Zones
The DNX/USDT chart indicates a descending channel pattern, suggesting a prolonged consolidation phase. Key levels to monitor for potential retests include:
Support Zone at the Lower Trendline: The price is approaching the lower boundary of the descending channel, which has acted as a strong support level in the past. This zone could serve as a pivotal area to test the trend’s strength.
Horizontal Resistance Zone: A retest of the highlighted orange zone above the price could indicate whether the trend is preparing for a breakout or continuing its downward trajectory.
The RSI is currently neutral, suggesting a balanced momentum. Observing these retest areas will provide insights into the strength of the support and the potential for a breakout from the descending channel.
💡 This analysis is for informational purposes only. Each trader should consider other factors and conduct personal research to make informed decisions.


